The value for fp , fs
, and fT are estimated from the graph, (from part 1 answer)
fs = 3417 Hz
fp = 243 Hz
fT= 8000 Hz
normalized stopband edge frequency
ws = 2*fs / fT = 2*3417 / 8000 = 0.85425
normalized passband edge frequency
wp = 2*fp / fT = 2*243 / 8000 = 0.06075
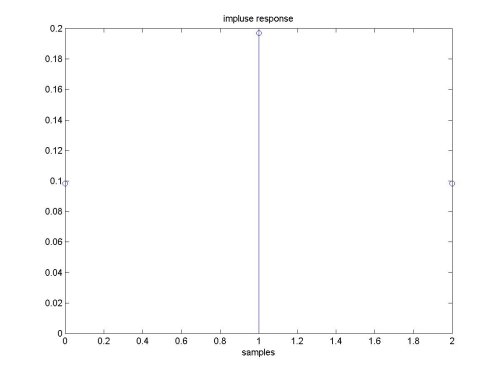
filter order , N = 2 (value return from buttord
function)
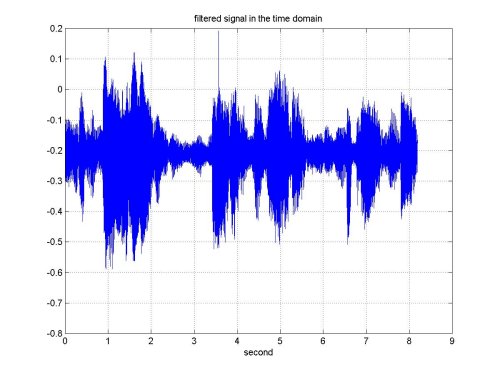
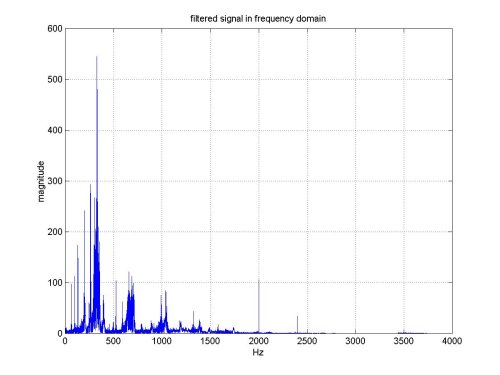
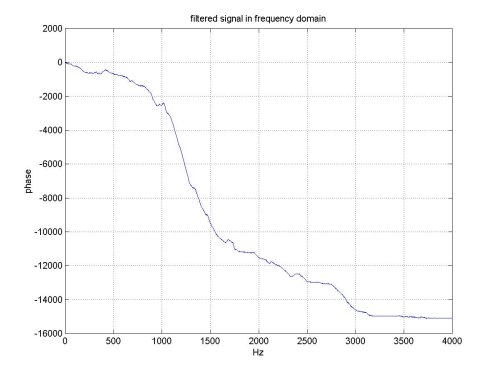
The results of the filtered process is a filtered signal sound which is noise free and almost sounds the same as original signal sound. Except it is lower in volume compare to the original one. The resultants graph produced and required is at below.
MSE and SNR (after filtering) calculated using
matlab code , please refer to this link MSE&SNR
to see the matlab code
MSE for noisy signal after filtering = 0.0507
SNR for noisy signal after filtering = -11.1541
MSE for noisy signal before filtering = 0.0573
SNR for noisy signal before filtering = -12.3869
SNR before filtering is smaller than the
SNR after filtering , which means the filtered signal has better quality
and less noise.
Graph for original signal & Graph for noisy signal ( please refer to this LINK to see the graphs )
Results from filtering process.

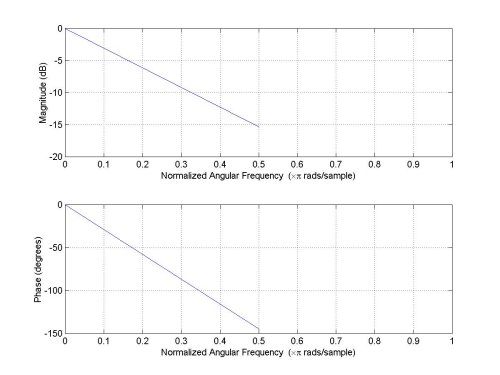
Graph for filtered signal
