Objectives : - analyze digital audio
signal with some added noise
- identify the noise signals and eliminate them using non real time digital
filtering techniques in Matlab
- design the lowpass FIR filters using Matlab
Equipments : orig1.wav and noisy1.wav files , Matlab software .
Procedure :
Exploratory Data Analysis
1) Wave files provided is collected. (Odd
ID wave file : orig1.wav and noisy1.wav )
2) Matlab software is used to analyze the
wave files provided. Analysis is based on both time and spectral domain.Example
of Matlab code used to analysed the time and frequency domain of audio
signals is as shown in lab sheet.
3) The example codes(follow this link
for the example code) given is studied and applied it in Matlab to perform
the time and frequency analysis for the given orig1.wav and noisy1.wav
files. The plots generated using Matlab on the time and frequency domain
analysis is shown to instructor.
Design and Implementation of lowpass FIR filters
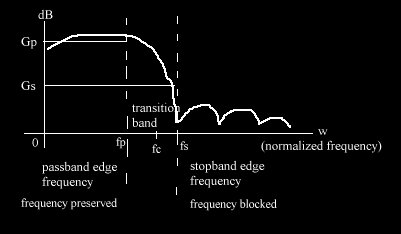
1) There are 4 specifications of FIR lowpass filter that is observed ,

2) The "fir1" command is studied.The argument Wn in fir1 function is representing normalized frequency, its relation is as shown below. Cutoff frequency fc is determined. ( fT is the sampling frequency )
Wn = 2*pi*fc / pi*fT = ( fp + fs ) / fT
3) Argument N in the fir1 function represents
the length( number of impulse) of the lowpass filter. Longer N gives better
filtering effects ( better attenuation and passband gain ) however it needs
more computation. This experiment requirement to be achieved is a passband
gain | Gp | < 3 dB and stopband attenuation |Gs| > 20 dB. The minimum
length N that can be used to obtain a lowpass FIR filter that fullfills
the passband and the stopband specifications is determined.
4)The FIR filter is designed using fir1 function
in Matlab. The designed filter frequency responses(magnitude and phase)
is plotted to check for specifications requirement. The filter coefficients
is saved when the designed filter met the requirements, otherwise redesign
with other parameters. The impulse response is plotted using stem function.
5)The noise is removed using the the designed
filter by the filter( ) Matlab function. For example if the noisy signal
is stored in vector x and the designed FIR filter coefficients are stored
on the vector h then the filtered signal is obtained by

